Volume bar range# Volume Bar Range (VBR) Indicator
## Overview
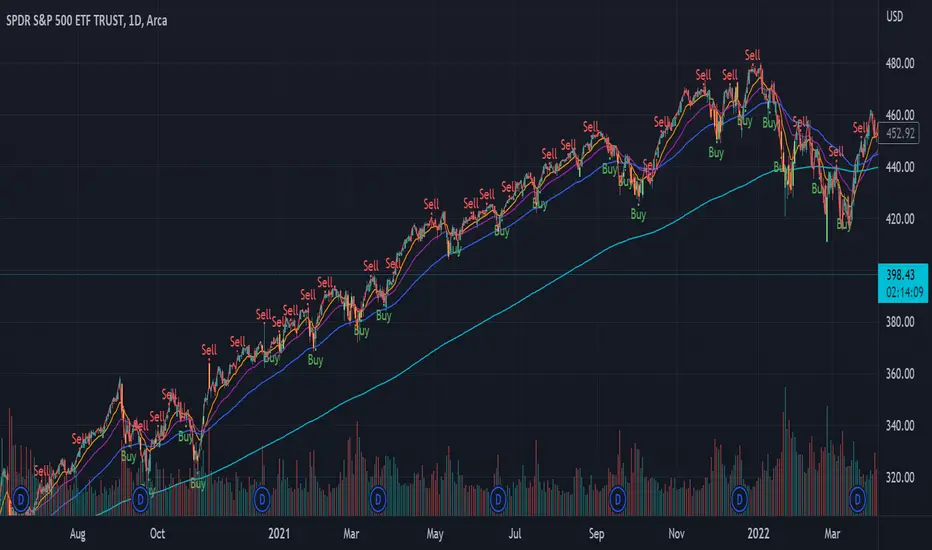
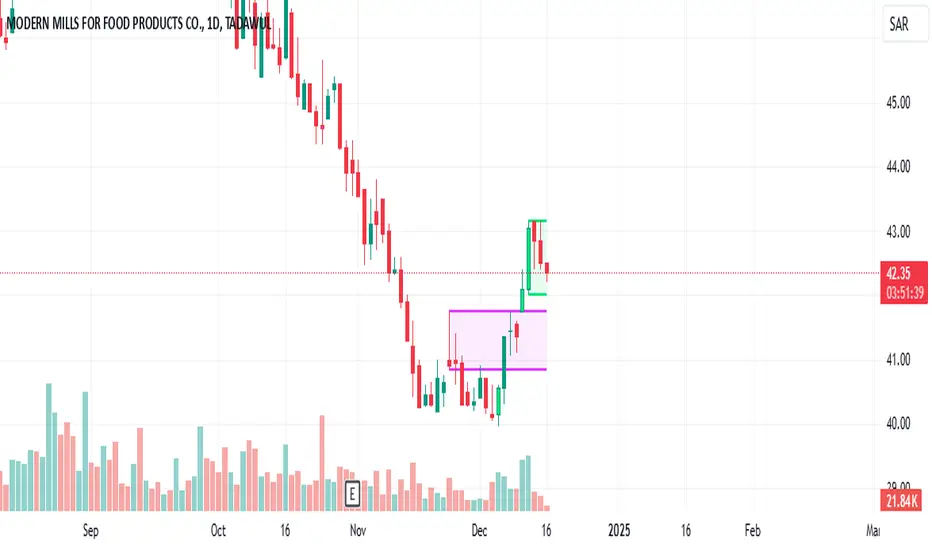
The Volume Bar Range indicator identifies key support and resistance levels based on high-volume price bars. It creates a visual range that represents significant price levels where the market has shown strong interest through volume confirmation.
## Features
### Visual Range Display
- **Blue/Aqua Area**: Shows the price range of the highest volume bar within the lookback period
- **Dynamic Color**: The fill color changes to indicate whether the range is stable (aqua) or newly updated (white)
- **Boundary Lines**: Invisible white lines mark the upper and lower boundaries of the range
### Trading Signals
- **BUY Signal**: Blue upward arrow appears when price breaks above the resistance level with volume confirmation
- **SELL Signal**: Black downward arrow appears when price breaks below the support level with volume confirmation
## How to Use
### Setup
1. Apply the indicator to any chart
2. The indicator automatically identifies the highest volume bar in the last 55 periods
3. The price range of this high-volume bar becomes your support/resistance zone
### Trading Strategy
- **Range Trading**: Trade within the identified support/resistance range
- **Breakout Trading**: Enter positions when price breaks above resistance (BUY) or below support (SELL)
- **Volume Confirmation**: Only take signals when current volume exceeds the 21-period average
### Signal Interpretation
- **BUY Signal**: Price closes above the resistance level with above-average volume
- **SELL Signal**: Price closes below the support level with above-average volume
- **No Signal**: Price remains within the range or volume is insufficient
## Key Parameters
- **Lookback Period**: 55 bars (automatically identifies the highest volume bar)
- **Volume MA**: 21-period simple moving average for volume confirmation
- **Signal Size**: Tiny markers to avoid chart clutter
## Best Practices
- Use on multiple timeframes for confirmation
- Combine with other technical indicators for stronger signals
- Pay attention to the color changes in the range area
- Consider market context and overall trend direction
## Ideal Markets
- Works well on liquid markets with consistent volume patterns
- Effective on stocks, forex, and crypto markets
- Best suited for swing trading and medium-term analysis
This indicator is particularly useful for traders who rely on volume analysis and want to identify key price levels where the market has shown significant interest.
Search in scripts for "VOLUME BAR"

Volume Bars - Leviathan x Tradingriot This script is a collaboration with Tradingriot. It improves the regular volume indicator by coloring the bars based on different criteria to provide additional insights into market activity.
Coloring conditions are calculated using a combination of relative volume (current trading volume relative to past trading volume) and price movements (candle high-low range):
1. **High Volume**: This is represented by bars that exceed a user-defined relative volume (RVOL) or are the highest volume over a certain lookback period. They often signal a start or the end of a price move.
2. **Low Volume**: These are bars where volume is lower than a certain RVOL or is the lowest volume over a certain lookback period. Low Volume bars often act as weak spots that later get filled.
3. **Churn Bars**: Churn bars represent periods where there is a lot of volume, but little price movement. They often signal a start or the end of a price move.

Volume Bars ColorThe Volume Bars Color indicator for the TradingView platform is a tool for visualizing trading volumes based on their values. It colors volume histograms on the chart according to their relative magnitude compared to the average volume and standard deviation.
Features:
- Volumes exceeding the average value by more than one standard deviation are considered large and highlighted in red.
- Volumes lower than the average by more than one standard deviation are considered low and displayed in orange.
- Volumes within one standard deviation of the average are considered average and marked in gray.
- Users can adjust the period for calculating the average volume.
How to Use:
- Add the indicator to your chart.
- Adjust the period for calculating the average volume using the corresponding parameter.
- Observe how trading volumes on the chart are colored based on their magnitude relative to the average volume and standard deviation.
Example Usage:
On the chart, red volume histograms indicate periods of high trading activity, orange histograms signify low trading volume, and gray histograms represent average trading volume.
Remember:
The Volume Bars Color indicator helps visualize trading volumes and identify periods with the most active or least active trading volume. However, it should be used in conjunction with other tools and analytical methods to make informed trading decisions.

[RS]Volume BarsVolume Bars inspired by Richard W. Arms Jr. EquiVolume.
the bars change in width by the amount of volume within that bar.
see links in the source code for reference.
Volume Bar Breakout and Breakdown IndicatorVolume shows strength of a movement and highest volume shows the region that pushed price to certain extent with full strength. Breakout or Breakout of the highest volume bar range shows continuity further push by sellers or buyers indicating a trend continuation for a small period if not for long duration. Entries can be taken once signal is generated with stoploss as recommended.
Guidelines:
Don't trade if range is too large
Don't trade if Breakdown or Breakdown candle body / range is too large or if there is high volatility
Use additional indicator to get the idea of overall trend analysis

Volume Bar New versionOk this is my modification to volume bar
it has two version repaint and non repaint (still serching for solution to it )
I put two source for buy and sell
I find that combination of low and low have to have least repaint issue
and buy =close source ,sell =low source the next least repaint
you can use the non repainted bar
only problem is that tey have lag issue of 1 mTF
I put shift control mechanisms to reduce repaint in the repianted version
the color are done by inverse fisher RSI
it nice tol to put on screen
alerts not included but can be added 'maybe I add them later ?
green strong =buy,
lime =weaker
red=sell
I hope you like this version :)

High Volume Bars (Advanced)High Volume Bars (Advanced)
High Volume Bars (Advanced) is a Pine Script v6 indicator for TradingView that highlights bars with unusually high volume, with several ways to define “unusual”:
Classic: volume > moving average + N × standard deviation
Change-based: large change in volume vs previous bar
Z-score: statistically extreme volume values
Robust mode (optional): median + MAD, less sensitive to outliers
It can:
Recolor candles when volume is high
Optionally highlight the background
Optionally plot volume bands (center ± spread × multiplier)
⸻
1. How it works
At each bar the script:
Picks the volume source:
If Use Volume Change vs Previous Bar? is off → uses raw volume
If on → uses abs(volume - volume )
Computes baseline statistics over the chosen source:
Lookback bars
Moving average (SMA or EMA)
Standard deviation
Optionally replaces mean/std with robust stats:
Center = median (50th percentile)
Spread = MAD (median absolute deviation, scaled to approx σ)
Builds bands:
upper = center + spread * multiplier
lower = max(center - spread * multiplier, 0)
Flags a bar as “high volume” if:
It passes the mode logic:
Classic abs: volume > upper
Change mode: abs(volume - volume ) > upper
Z-score mode: z-score ≥ multiplier
AND the relative filter (optional): volume > average_volume * Min Volume vs Avg
AND it is past the first Skip First N Bars from the start of the chart
Colors the bar and (optionally) the background accordingly.
⸻
2. Inputs
2.1. Statistics
Lookback (len)
Number of bars used to compute the baseline stats (mean / median, std / MAD).
Typical values: 50–200.
StdDev / Z-Score Multiplier (mult)
How far from the baseline a bar must be to count as “high volume”.
In classic mode: volume > mean + mult × std
In z-score mode: z ≥ mult
Typical values: 1.0–2.5.
Use EMA Instead of SMA? (smooth_with_ema)
Off → uses SMA (slower but smoother).
On → uses EMA (reacts faster to recent changes).
Use Robust Stats (Median & MAD)? (use_robust)
Off → mean + standard deviation
On → median + MAD (less sensitive to a few insane spikes)
Useful for assets with occasional volume blow-ups.
⸻
2.2. Detection Mode
These inputs control how “unusual” is defined.
• Use Volume Change vs Previous Bar? (mode_change)
• Off (default) → uses absolute volume.
• On → uses abs(volume - volume ).
You then detect jumps in volume rather than absolute size.
Note: This is ignored if Z-Score mode is switched on (see below).
• Use Z-Score on Volume? (Overrides change) (mode_zscore)
• Off → high volume when raw value exceeds the upper band.
• On → computes z-score = (value − center) / spread and flags a bar as high when z ≥ multiplier.
Z-score mode can be combined with robust stats for more stable thresholds.
• Min Volume vs Avg (Filter) (min_rel_mult)
An extra filter to ignore tiny-volume bars that are statistically “weird” but not meaningful.
• 0.0 → no filter (all stats-based candidates allowed).
• 1.0 → high-volume bar must also be at least equal to average volume.
• 1.5 → bar must be ≥ 1.5 × average volume.
• Skip First N Bars (from start of chart) (skip_open_bars)
Skips the first N bars of the chart when evaluating high-volume conditions.
This is mostly a safety / cosmetic option to avoid weird behavior on very early bars or backfill.
⸻
2.3. Visuals
• Show Volume Bands? (show_bands)
• If on, plots:
• Upper band (upper)
• Lower band (lower)
• Center line (vol_center)
These are plotted on the same pane as the script (usually the price chart).
• Also Highlight Background? (use_bg)
• If on, fills the background on high-volume bars with High-Vol Background.
• High-Vol Bar Transparency (0–100) (bar_transp)
Controls the opacity of the high-volume bar colors (up / down).
• 0 → fully opaque
• 100 → fully transparent (no visible effect)
• Up Color (upColor) / Down Color (dnColor)
• Regular bar colors (non high-volume) for up and down bars.
• Up High-Vol Base Color (upHighVolBase) / Down High-Vol Base Color (dnHighVolBase)
Base colors used for high-volume up/down bars. Transparency is applied on top of these via bar_transp.
• High-Vol Background (bgHighVolColor)
Background color used when Also Highlight Background? is enabled.
⸻
3. What gets colored and how
• Bar color (barcolor)
• Up bar:
• High volume → Up High-Vol Color
• Normal volume → Up Color
• Down bar:
• High volume → Down High-Vol Color
• Normal volume → Down Color
• Flat bar → neutral gray
• Background color (bgcolor)
• If Also Highlight Background? is on, high-volume bars get High-Vol Background.
• Otherwise, background is unchanged.
⸻
4. Alerts
The indicator exposes three alert conditions:
• High Volume Bar
Triggers whenever is_high is true (up or down).
• High Volume Up Bar
Triggers only when is_high is true and the bar closed up (close > open).
• High Volume Down Bar
Triggers only when is_high is true and the bar closed down (close < open).
You can use these in TradingView’s “Create Alert” dialog to:
• Get notified of potential breakout / exhaustion bars.
• Trigger webhook events for bots / custom infra.
⸻
5. Recommended presets
5.1. “Classic” high-volume detector (closest to original)
• Lookback: 150–200
• StdDev / Z-Score Multiplier: 1.0–1.5
• Use EMA Instead of SMA?: off
• Use Robust Stats?: off
• Use Volume Change vs Previous Bar?: off
• Use Z-Score on Volume?: off
• Min Volume vs Avg (Filter): 0.0–1.0
Behavior: Flags bars whose volume is notably above the recent average (plus a bit of noise filtering), same spirit as your initial implementation.
⸻
5.2. Volatility-aware (Z-score) mode
• Lookback: 100–200
• StdDev / Z-Score Multiplier: 1.5–2.0
• Use EMA Instead of SMA?: on
• Use Robust Stats?: on (if asset has huge spikes)
• Use Volume Change vs Previous Bar?: off (ignored anyway in z-score mode)
• Use Z-Score on Volume?: on
• Min Volume vs Avg (Filter): 0.5–1.0
Behavior: Flags bars that are “statistically extreme” relative to recent volume behavior, not just absolutely large. Good for assets where baseline volume drifts over time.
⸻
5.3. “Wake-up bar” (volume acceleration)
• Lookback: 50–100
• StdDev / Z-Score Multiplier: 1.0–1.5
• Use EMA Instead of SMA?: on
• Use Robust Stats?: optional
• Use Volume Change vs Previous Bar?: on
• Use Z-Score on Volume?: off
• Min Volume vs Avg (Filter): 0.5–1.0
Behavior: Emphasis on sudden increases in volume rather than absolute size – useful to catch “first active bar” after a quiet period.
⸻
6. Limitations / notes
• Time-of-day effects
The script currently treats the entire chart as one continuous “session”. On 24/7 markets (crypto) this is fine. For regular-session assets (equities, futures), volume naturally spikes at open/close; you may want to:
• Use a shorter Lookback, or
• Add a session-aware filter in a future iteration.
• Illiquid symbols
On very low-liquidity symbols, robust stats (Use Robust Stats) and a non-zero Min Volume vs Avg can help avoid “everything looks extreme” problems.
• Overlay behavior
overlay = true means:
• Bars are recolored on the price pane.
• Volume bands are also drawn on the price pane if enabled.
If you want a dedicated panel for the bands, duplicate the logic in a separate script with overlay = false.

High Threshold Volume BarHigh Threshold Volume Bar (HP Vol Bar) has the following features highlighted below.
Overview:
The High Threshold Volume Bar (HP Vol Bar) is an advanced technical analysis tool designed to identify statistically significant price bars based on volume, range, and trend dynamics. It helps traders spot high-probability continuation or reversal setups by analyzing bar size relative to historical volatility, volume spikes, and trend strength.
Key Features
1. Adaptive Threshold Detection
.Uses standard deviation bands and moving averages to dynamically adjust the significance threshold based on recent market conditions.
.Bars exceeding this threshold are flagged as "significant" and color-coded for easy identification.
2. Volume & Range Normalization
.Adjusts bar size calculations by factoring in volume spikes (relative to SMA-smoothed volume) and full price range (high-low or just body size).
.Prevents false signals by capping extreme volume outliers.
3. Trend Strength & Direction
Incorporates Directional Movement (DMI) to assess trend strength.
Classifies signals as continuation or reversal based on trend alignment.
4. Percentile Ranking
.Compares current bar size against a lookback period (default: 100 bars) to determine its statistical rarity (top 20% = high significance).
5. Consecutive Signal Filtering
.Requires multiple consecutive significant bars (configurable) to confirm high-probability setups, reducing noise.
6. Visual & Alert System
.Color-coded bars:
.Blue (Bullish Continuation) / Pink (Bearish Continuation) for high-probability signals.
.Teal (Bullish) / Maroon (Bearish) for significant but unconfirmed bars.
.Info Table: Displays real-time metrics (signal type, percentile, trend strength, volatility regime).
.Alerts: Triggers when a high-probability sequence is detected.
Input Parameters
1. Parameter Description Default
2. SMA Length Smoothing period for average bar size. 50
3. Standard Deviation Period Lookback for volatility calculation. 20
4. Standard Deviation Multiplier Adjusts sensitivity of threshold. 2.5
5. Factor in Volume Normalizes bar size using volume. true
6. Use Full Range Measures high-low instead of open-close. true
7. Min Consecutive Bars Required confirmations for high-probability signals. 2
8. Historical Comparison Period Lookback for percentile ranking. 100
9. Trend Strength Period Smoothing for DMI-based trend assessment. 14
How It Works
1. Calculates Bar Size:
.Uses either full range (high-low) or body size (open-close).
.Adjusts for volume spikes via EMA-normalized volume.
2. Determines Significance:
.Bar size must exceed:
.Adaptive threshold = SMA + (StdDev × Multiplier × Volatility Factor).
.Percentile rank > 80% (top 20% of recent bars).
.Trend strength > 20% (DMI-derived).
3. Classifies Signals:
.Continuation: Significant bar aligns with prior trend.
.Reversal: Significant bar contradicts prior trend.
4. Confirms High-Probability Setups:
.Requires consecutive significant bars (user-defined) to filter noise.
7. Usage Guidelines
.Bullish Signals: Look for blue bars (confirmed) or teal bars (unconfirmed) in uptrends.
.Bearish Signals: Look for pink bars (confirmed) or maroon bars (unconfirmed) in downtrends.
.Alerts: Use built-in alerts to notify when a high-probability sequence forms.
.Combine With: Support/resistance levels, candlestick patterns, or momentum oscillators for confluence.
8. Why This Script?
.Dynamic Adaptation: Adjusts to changing volatility and volume regimes.
.Statistical Rigor: Uses percentile ranking to avoid overfitting.
.Clear Visuals: Intuitive color-coding and table for quick analysis.
Note: This is a closed-source script, but the logic is transparently explained to ensure traders understand its methodology.
How to Use "High Threshold Volume Bar" for Trade Entries
The HP Vol Bar indicator identifies high-probability trade setups based on statistically significant price bars. Here’s how to use it for entries, exits, and trade management:
1. Trade Entry Rules (Table Values to consider to trade)
A) Bullish Continuation Setup (Trend Following)
Conditions:
✅Signal Status: Active
✅ Signal Type: bullish_cont (Blue,Teal bar)
✅Size percentile: 90%
✅ Trend Strength: > 20% (Strong trend)
✅ Consecutive Bars: ≥ 1or2
✅ Volume Regime : High
Entry:
.Buy at the close of the second (or Nth) confirmed blue bar.
.Stop Loss (SL): Below the lowest bar in the sequence.
.Take Profit (TP):
1.5× to 2× the bar size (adaptive to volatility).
Example:
Bearish Continuation Example
B) Bearish Continuation Setup (Trend Following)
Conditions:
✅Signal Status: Active
✅ Signal Type: bearish_cont (Pink bar)
✅Size percentile: 90%
✅ Trend Strength: > 20%
✅ Consecutive Bars: ≥ 1or2
✅ Volume Regime : High
Entry:
Sell Short at the close of the second (or Nth) confirmed pink bar.
Stop Loss (SL): Above the highest bar in the sequence.
Take Profit (TP): Similar to bullish (1.5-2× bar size).
C) Bullish/Bearish Reversal Setup (Counter-Trend)
Conditions:
✅Signal Status: Active
✅ Signal Type: bullish_rev or bearish_rev
✅Size percentile: 90%
✅ Trend Strength: > 20%
✅ Consecutive Bars: ≥ 1or2
✅ Volume Regime : High
Entry:
Wait for confirmation (next bar closes in reversal direction).
SL: Opposite extreme of the signal bar.
Example:
Reversal Example
2. Filtering & Confluence (Improving Accuracy)
Trend Alignment: Only trade in the direction of the higher timeframe trend (e.g., use EMA 50/200)
Support/Resistance: Enter near key levels for better risk-reward.
Volume Confirmation: Avoid signals with below-average volume.
3. Advanced Strategies
A) Breakout Confirmation
If a significant bar breaks a key level, enter on retest.
Example: Blue bar breaks resistance → Buy on pullback.
B) Mean Reversion (Range Markets)
Use low volatility mode (volRegimeText = "LOW") + reversal signals.
Fade extreme moves back to the mean (e.g., SMA).

Lower Timeframe Volume BarsDescription:
The Lower Timeframe Volume Bars indicator enhances your TradingView experience by allowing you to visualize volume data from lower timeframes on your current chart. This powerful tool helps you gain deeper insights into volume trends and activity that are not immediately visible on higher timeframe charts. Specifically, it shows the volume data from the last bar of the selected lower timeframe.
Key Features:
Volume Bars from Lower Timeframes:
Display volume data from 1-minute or 1-second timeframes directly on higher timeframe charts, such as 15 minutes or 1 hour.
Each volume bar represents the aggregated volume from the lower timeframe within the selected higher timeframe period.
Enhanced Volume Analysis:
Gain a more detailed understanding of volume spikes and troughs that may be hidden in higher timeframe charts.
Identify potential market turning points and confirm trends with precise volume data.
Customizable Display:
Adjust the appearance of volume bars to fit your chart style and preferences.
Configure settings such as color, size, and positioning of volume bars for optimal visibility and clarity.
Seamless Integration:
Easily add the indicator to any chart in TradingView with a few clicks.
Works in conjunction with other technical indicators and tools to provide a comprehensive analysis environment.
How to Use:
Add the Lower Timeframe Volume Bars indicator to your chart.
Select the lower timeframe you wish to fetch volume data from (e.g., 1-minute or 1-second).
Customize the display settings to match your charting style.
Observe the volume bars overlaying your current chart to analyze volume activity across different timeframes, specifically showing the last bar's volume.
Use the detailed volume information to make informed trading decisions and enhance your market analysis.
Benefits:
Increased Clarity: See detailed volume activity that is often lost in higher timeframe aggregation.
Better Decision Making: Make more informed trading decisions with a clear view of volume trends and spikes.
Improved Trend Confirmation: Use lower timeframe volume data to confirm the strength and sustainability of market trends.
Enhance your trading strategy and gain a deeper understanding of market dynamics with the Lower Timeframe Volume Bars indicator. Visualize, analyze, and trade with confidence by leveraging detailed volume insights from lower timeframes.

Buy-Sell Volume Bar Gauge [By MUQWISHI]▋ INTRODUCTION :
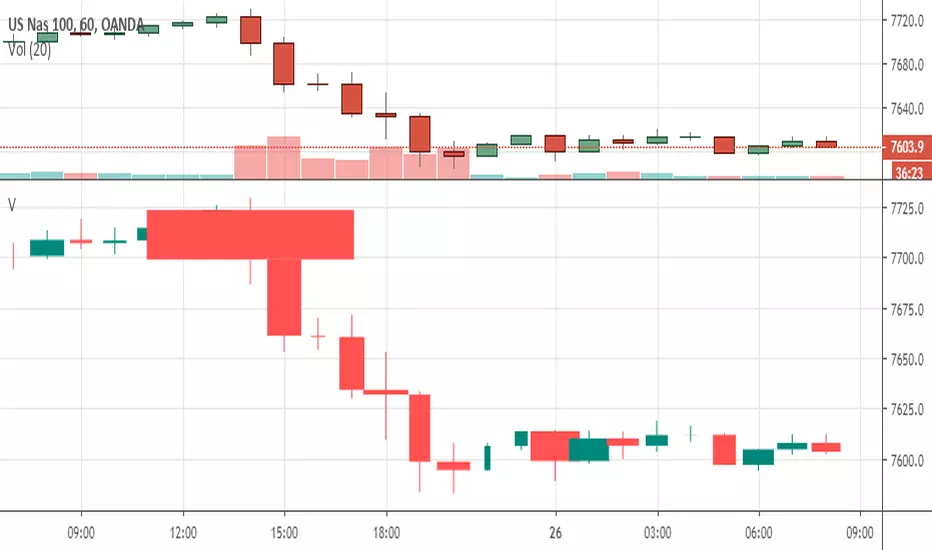
The Buy-Sell Volume Bar Gauge is developed to provide traders with a detailed analysis of volume in bars using a low timeframe, such as a 1-second interval, to measure the dominance of buy and sell for each bar. By highlighting the balance between buying and selling activities, the Buy-Sell Volume Bar Gauge helps traders identify potential volume momentum of a bar; aimed at being a useful tool for day traders and scalpers.
_______________________
▋ OVERVIEW:
_______________________
▋ METHODOLOGY:
The concept is based on bars from a lower timeframe within the current chart timeframe bar, where volume is categorized into Up, Down, and Neutral Volume, with each one displayed as a portion of a column plot. Up Volume is recorded when the price experiences a positive change, Down Volume occurs when the price experiences a negative change, and Neutral Volume is observed when the price shows no significant change.
_______________________
▋ INDICATOR SETTINGS:
(1) Fetch data from the selected lower timeframe. Note: If the selected timeframe is invalid (higher than chart), the indicator will automatically switch to 1 second.
(2) Price Source.
(3) Treating Neutral Data (Price Source) as
Neutral: In a lower timeframe, when the bar has no change in its price, the volume is counted as Neutral Volume.
Previous Move: In a lower timeframe, when the bar has no change in its price, the volume is counted as the previous change; “Up Volume” if the previous change was positive, and “Down Volume” if the previous change was negative.
Opposite Previous Move: In a lower timeframe, when the bar has no change in its price, the volume is counted as the opposite previous change; “Up Volume” if the previous change was negative, and “Down Volume” if the previous change was positive.
(4) Average Volume Length, it's used for lighting/darkening columns in a plot.
(5) Enable Alert.
(7) Total bought (%) Level.
(8) Total Sold (%) Level.
_____________________
▋ COMMENT:
The Buy-Sell Volume Bar Gauge can be taken as confirmation for predicting the next move, but it should not be considered a major factor in making a trading decision.

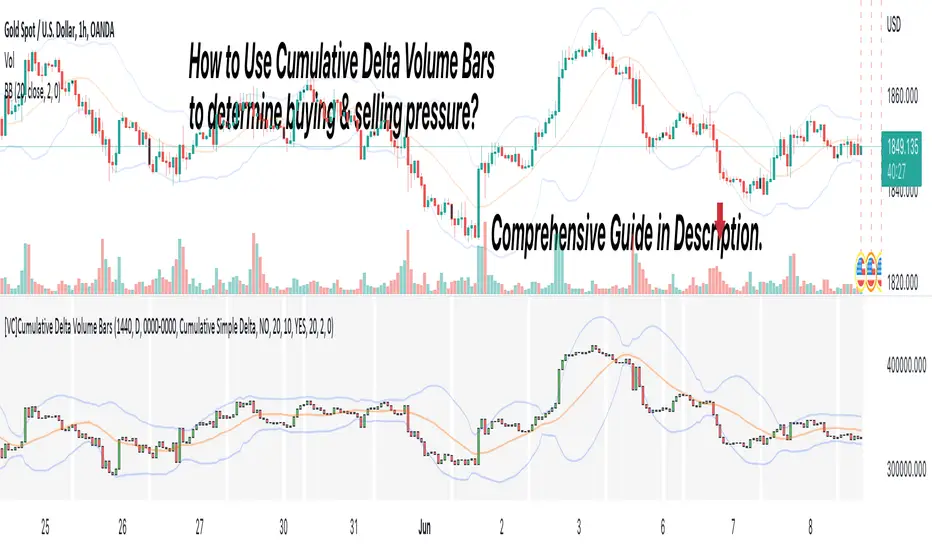
[VC] Cumulative Delta Volume BarsLet's first learn what is Delta & How to Use Cumulative Delta Volume Bars?
Cumulative Delta Volume Bars is one of the leading indicators that you can use when trading order flow. It gives you an instant snapshot of the buying and selling pressure in a market.
After reading the detailed description of "Cumulative Delta Volume Bars," you will understand how volume delta provides a critical edge by allowing you to spot significant potential reversals in the market. You will also learn to use this Cumulative Delta indicator in depth. (including rest session usability features)
What is Delta Volume?
Delta Volume is the difference between Buying and Selling Power. Delta Volume is calculated by taking the difference between the volume traded at the offer price and the volume traded at the bid price. (in simple words, the difference between buying pressure & selling pressure)
If delta volume is more than zero, you have more buying pressure than selling & vice versa, and if delta volume is less than zero, you have more selling pressure than buying.
In Order-Flow Analysis , traders used Cumulative Delta to measure the relationship between the Buying & Selling pressure Vs Price.
Cumulative delta volume takes the delta values for every bar and successively adds them together to provide a graph, as seen below visually.
Let me demonstrate by giving examples of how cumulative Delta can help measure the buying or selling pressure relative to the price move.
★ Trading Absorption & Exhaustion concepts with Delta
See the chart below & try to analyze the next possible move on the basses on the analysis mentioned on the chart.
➽➽ If you said Short, you were correct. ✅
Till Point A , both price & cumulative were aligned. (means there were no imbalances between Delta & Price).
But on Point B , the Cumulative Delta broke the previous resistance clearly and moved even further away from the resistance level, but the Price couldn't break the last resistance. It interprets that buyers applied a lot of buying pressure but no result. (Aggressive buying pressure absorbed by Passive sellers)
Due to this vast effort or failed attempt, buyers were exhausted and had no more strength to pull the Price up. That's why the Price reversed from Point B . See below image
★ Cumulative Delta Volume Bars is helpful when determining buying or selling pressure at different key price levels, such as swing highs or lows.
Let's recap on swing highs and swing lows.
➽ A swing high (S.H) is formed when the high reaches higher than the price action around it. Once the Price moves above a prior swing high and begins to retrace, a new swing high is formed.
➽ A swing low (S.L) is formed when the low reaches lower than price action around it. Once the Price moves below a prior swing low and begins to retrace, a new swing low is formed.
➽ When the Price makes higher highs and higher lows, a market is considered an uptrend.
➽ When the Price is making lower lows followed by lower highs, a market is considered a downtrend.
When evaluating Delta, it's beneficial to compare delta values at swing lows or swing highs to determine the amount of selling or buying pressure and how the market reacts.
The actual Power of Delta is revealed when we use it to determine the market's reaction to powerful buying or selling. We want to see if the market has reacted as we would expect or not.
In the above Example, you will notice that every time price breaks a swing, Delta does as well.
It makes sense as it takes selling pressure to break a swing low or buying pressure to break a swing high. In simple words, we can say that there is no anomaly between delta direction & price direction.
In simple words (No Absorption or Exhaustion)
But what's occurring when this isn't the case, and we have divergence between Price and Delta? Let's analyze it with real examples.
★ Understanding Delta Divergence.
(Lack of Harmony in Buying/Selling Pressure & Price Move)
Notice how the Price breaks out of the previous resistance level on the above chart, but the Delta didn't yet reach even close to its last resistance level. It's a clear divergence between Price and Delta. Buyers may be slightly exhausted at the previous resistance level, and Price & Delta may retrace slightly. But in a broader view, it reflects a strong bullish signal.
See the above chart & see when and why the Price moved. I hope it will help you understand the underlying relation & story between Price & Delta.
Cumulative Delta & Trade Management
Delta will help you spot significant reversals, but it can also be used to help manage your open trade. You want to see a high correlation between Delta and Price when in a long or short position.
Suppose you're short while the Price is breaking a new low. You want to see Delta breaking low if sellers aren't interested in selling at the recent lows, represented by Delta not breaking lows. The probability of a short term reversal or a significant retrace increases.
When in a position, always be on the lookout for exhaustion and absorption, signalling a reversal potential.
What Includes in V.C Cumulative Delta Volume Bars Indicator
Inputs & Settings
Reset accumulation on new session:
Allows you to rest accumulation at the start of each session (you may choose your customized starting & ending time as well by enabling ''Customize Rest Session Time''
Start/End of Session & During Session:
Allows you to show/hide & choose the background color & separator of each session
''Customize Rest Session Time''
When this setting is enabled, your customized given time will be applied, which can be set from the below box. Note: set your time in minutes. For Example, if you want to reset the session after every hour, you need to put 60. If you're going to reset after every 8 hours, you need to put 480. Additionally, your chart time frame must be lower than your customized rest time.
Reset Each Minutes:
Allows you to put your desired rest time in minutes. For Example, for 1 hour 60, for 8 hours 480. (8x60)
Reset Each:
Allows you to choose rest time from the drop-down menu. Note: To apply this setting, don't enable the ''CUSTOMIZE RESET SESSION TIME''.
Select Session:
Allows you to set customized starting & ending times of the session instead of the exchange's default time. For Example, the exchange reset time is 20:00, but if you want 22:00, first, you need to set your chart time as an exchange from the right bottom of the chart, and then you need to put 22:00 22:00 in both fields. Note: Put the same starting & ending time. In simple words, it should not be greater than or less than 24 hours.
Type:
It allows you to select Delta type. (there are two delta types you can choose from, 1st Simple Delta, 2nd Delta % or Volume Weighted Delta)
Candle Colors:
Allows you to change the color of candles.
Envelope Indicator:
Allows you to apply to Envelop Indicator on the delta candle. (all default settings of the Envelop Indicator can be customized as well)
See the below chart with Envelop applied to Delta Candles & Price Candles. (can be used to measure the Delta & Price movement at the micro-level)
Bollinger Bands Indicator:
Allows you to apply to Bollinger Bands Indicator on the delta candle. (all default settings of the Bollinger Bands Indicator can be customized as well)
See the below chart with Bollinger Bands applied to Delta Candles & Price Candles. (can be used to measure the Delta & Price movement at the micro-level)
Start/End of Session on Chart
Allows you to change the first & last candle of the session.
Style Settings:
Allows you to control all the visual settings of delta candles, Envelop & Bollinger bands.
-------------------------------------------------
➽Conclusion:
Cumulative Volume Delta Bars is one of the leading indicators you can include as an order flow trader in your arsenal. It gives you an inside look at buying and selling pressure and how the market reacts.
But Keep in mind, in trading & technical analysis, nothing is 100% certain. No indicator can give you a 100% success rate. There is no holy grail in the financial market. As a trader, with the help of technical & fundamental indicators, our goal is to find an edge over the market. A simple definition of an edge is: Anything that adds a few points to the winning side of an equation builds an edge that lasts a lifetime. A trading edge defines your technical or strategic advantage in the highly competitive market environment. Traders can establish multiple edges by starting with popular strategies and customizing rules to lower the risk of getting trapped with the emotional crowd.
Disclaimer Note:
V.C Cumulative Delta Volume Bars It is purely Volume, Delta, Demand & Supply imbalance and comparative analysis based tool. Before applying this Indicator to your study, you should know about Volume, Delta & Spread, Demand & Supply, and Aggressive & Passive behaviour of buyers/sellers.
Some basic understanding of Sir Richerd Wyckoff's Theory can also be helpful.
High Volume BarsThis indicator highlights the highest volume bullish and bearish bars within a specified lookback period. It provides a visual representation of significant volume activity, which can be useful for identifying potential trend reversals or continuations.
Key Features:
Customizable lookback period to find highest volume bars
Lime-colored bars for bullish (up) volume
Fuchsia-colored bars for bearish (down) volume
Filled areas between high and low of highest volume bars
Easy-to-read visual cues for volume analysis
The indicator scans the specified number of previous bars to identify the highest volume bullish and bearish bars. It then colors these bars and draws filled areas to make them stand out on the chart. This can help traders quickly spot areas of significant buying or selling pressure.
Use this indicator to:
Identify potential support and resistance levels
Spot volume-based trend reversals
Confirm breakouts or breakdowns
Enhance your volume analysis in conjunction with price action
Adjust the lookback period to fine-tune the indicator's sensitivity to recent volume activity. A longer lookback period will identify more significant volume events, while a shorter period will be more responsive to recent changes.
Note: This indicator is best used in combination with other technical analysis tools and should not be relied upon solely for making trading decisions.
Realtime Volume Bars w Market Buy/Sell/Neutral split & Mkt Delta
What is it?
A tool that shows Real-time Volume bars split into 3 components: (1) Market Buy Volume - i.e., the volume that got transacted on upticks; (2) Market Sell Volume - i.e., the volume that got transacted on downticks;
and, (3) Neutral Volume - i.e., the volume that got transacted without a change in price. (This feature can be turned off if you want normal volume bars).
Market delta (i.e., Market Buy Volume - Market Sell Volume) is also displayed above each volume bar. (On by default; can be switched off from Settings)
The split and Market Delta data are ONLY AVAILABLE FOR REAL-TIME BARS. Historical bars are shown just like regular ones. The dotted line marks the start of real-time data (i.e., the bar from which the indicator started collecting and displaying data). You will see accurate data for bars to the right of this line. The longer you keep a chart open with the study enabled, the more data it collects and displays, and the better your analysis can potentially be.
Note that the data gets reset every time any of the options is changed, the market is switched, the browser is refreshed, or the script is reloaded
DATA ISN'T STORED. I.e., every time a new symbol is loaded, the previous symbol's data is lost. So if you intend to monitor a symbol, you would need to keep it loaded all the time.
Who is it for?
For traders who are used to analyzing buy/sell activity using market buy/sell volume and market delta information
Although you can use this independently as well, use it in conjunction with "Market Delta Volume for Realtime Bars" indicator to get a better visual representation of the numbers.

Colored Volume Bars [LazyBear]Edgar Kraut proposed this simple colored volume bars strategy for swing trading.
This is how the colors are determined:
- If today’s closing price and volume are greater than 'n' days ago, color today’s volume bar green.
- If today’s closing price is greater than 'n' days ago but volume is not, color today’s volume bar blue.
- Similarly, if today’s closing price and volume is less than 'n' days ago, color today’s volume bar orange.
- If today’s closing price is less than 'n' days ago but volume is not, color today’s volume bar red.
Buy the green or blue volume bars, use a 1% trailing stop, and stand aside on red or orange bars.
As you see, this is more for entry confirmation. I have not tested this on any instrument.
You may have to tune the lookback period for your instrument. Default is 10.
More info:
"A color-based system for short-term trading" - www.traders.com
List of all my indicators:

Colored Volume Bars standard deviation from meanThe colour bars:
Green: Price up - Volume > 2 x STD of last 21 bars
Blue: Price up - Volume > 1 x STD of last 21 bars
Maroon: Price down - Volume > 2 x STD of last 21 bars
Purple: Price down - Volume > 1 x STD of last 21 bars
Grey: not high volume bar
Green line: 2 bar sma
Red line: 8 period sma of the greenline
Bollinger band: 55 period sma of the 21 period sma with bands 1.618 deviation from the mean

Real Relative Volume - Bar Indicator - Time Adjusted - DE & ENEnglish version below
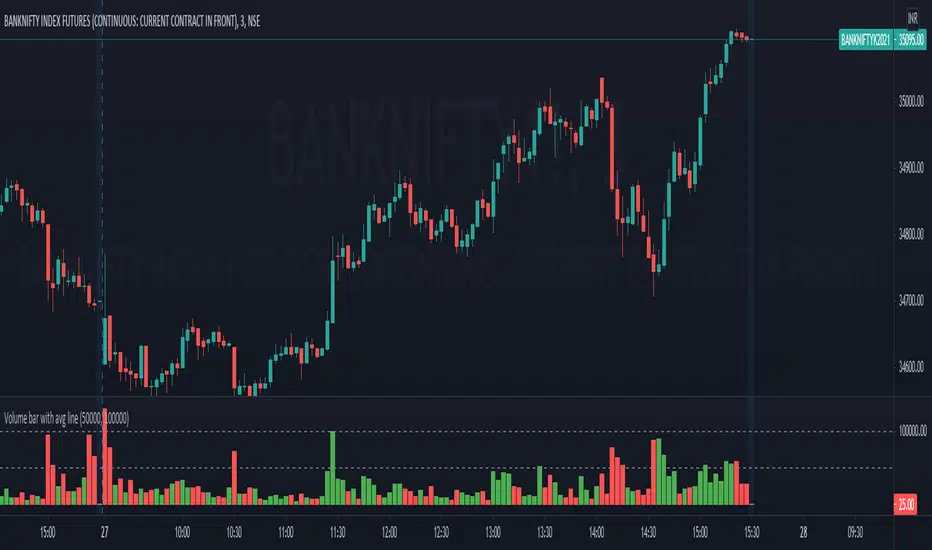
Die richtige Aktie zu finden, ist nich immer einfach. Eine wichtige Variable bei der Aktienauswahl stellt das relative Volumen dar, welches von vielen erfolgreichen Tradern und Trading Firmen benutzt wird. Stell es Dir so vor: Statt sich das absolute Volumen anzuschauen, schauen wir uns die tatsächliche Stärke an. Wie viel Volumen wird also heute im Vergleich zu einem regulären Tag gehandelt. Dies gibt Aufschluss darüber, ob die Aktie "In-Play" ist.
Merke: Ist das RVOL (Relative Volumen) erhöht, sind mehr Marktteilnehmer an dieser Aktie interessiert als üblich. Dies ist besonders dann wichtig, wenn die Marktrichtung und die Richtung der Aktie nicht übereinstimmen.
Wenn der Markt steigt, steigen auch die meisten Aktien. Dies kann folglich auch ohne erhöhtes RVOL passieren. Was ist aber, wenn der Markt gegen uns geht? Dann werden wir schnell bei RVOL-schwachen Aktien ausgeschüttelt. Daher wollen wir unseren Fokus immer auf Aktien setzen, die ein erhöhtes relatives Volumen haben! Dies sind die Aktien, die gerade wirklich stark gehandelt werden und wahrscheinlich einen Katalysten dafür haben.
Der Real Relative Volume - Bar Indicator zeigt Dir das aktuelle relative Volumen an. Unser Algo benutzt dabei das tatsächliche kumulative Volumen des aktuellen Tages zum jeweiligen (aktuellen) Zeitpunkt und vergleicht dieses mit dem historischen Durchschnittsvolumen zum gleichen Zeitpunkt. Damit bekommen wir ein korrektes Abbild der aktuellen Stärke. Mit Hilfe des Indikators können wir durch die farbliche Veränderung der Volumenbalken ebenfalls sehen, ob diese Stärke zunimmt, gleich bleibt, oder gegebenenfalls schnell and Power verliert. Im Gegensatz zu anderen Skripten nutzen wir eine fortschrittliche Methode, die aktuelle Position am Tag erkennt und damit nicht die Session in gleiche Teile teilt. Vorteil: Der Indikator funktioniert auch in Krypto, Forex, DE-Aktien, Indizes etc.
Funktionen:
Bitte ohne verlängerte Handelszeiten nutzen!
Sessions Back: Verändert die Baseline, die Du mit dem heutigen Volumen vergleichst. Beispiel: 10 - Zur aktuellen Uhrzeit siehst Du das reale relative Volumen von heute in Relation zu den letzten 10 Sessions (zur gleichen Zeit). (*max 5000 Kerzen)
RVOL Threshold: Wert für die RVOL Alarme sowie zur Färbung bei Nutzung des Modus Threshold.
Plot styles: Du hast die Möglichkeit aus 4 verschiedenen Styles zu wählen.
Heatmap (greift auf die Werte und Farben von HM1-HM5 zurück)
Traffic (greift auf die Werte und Farben von T1-T4 zurück) -
Threshold (greift auf den Werte RVOL Threshold zurück)
Kurs (zeigt die normalen Volumenbalken)
HM1-5: Stelle unterschiedliche RVOL Werte für den Plot Style Heatmap ein.
T1-4: Stelle unterschiedliche RVOL Werte für den Plot Style Traffic ein.
Dieser Indikator wird häufig mit unserer zweiten Version Real Relative Volume - Line Indicator - Time Adjusted - DE & EN verwendet. Stelle sicher, dass Du in beiden Indikatoren die gleichen RVOL Werte nutzt!
-------------
English version
Finding the right stock to trade is not always easy. An important variable in stock selection is the relative volume, which is used by many successful traders and trading firms. Think of it like this: Instead of looking at absolute volume, we look at actual strength. So how much volume is traded today compared to a regular day? This gives an indication of whether the stock is "in play".
Note: If the RVOL (relative volume) is increased, more market participants are interested in this share than usual. This is especially important if the market direction and the direction of the stock do not match.
If the market rises, most shares will also rise. This can, therefore, happen without an increased RVOL. But what happens if the market goes against us? Then we are quickly shaken out of RVOL-weak stocks. Therefore, we always want to focus on stocks that have an increased relative volume! These are the stocks that are trading really strongly right now and probably have a catalyst for that.
The Real Relative Volume - Bar Indicator shows you the current relative volume. Our Algo uses the actual cumulative volume of the current day at the respective (current) time and compares it with the historical average volume at the same time. This gives us a correct picture of the current strength. With the help of the indicator, we can also see by the color change of the volume bars whether this strength increases, remains the same, or loses power quickly. Unlike other scripts, we use an advanced method that recognizes the current position on the day and does not split the session into equal parts. Advantage: The indicator also works in crypto, forex, foreign stock markets, indices, etc.
Features:
Please use without extended trading hours!
Sessions Back: Changes the baseline that you compare to today's volume. Example: 10 - At the current time you see the real relative volume of today in relation to the last 10 sessions (at the same time). (*max 5000 candles)
RVOL Threshold: Value for the RVOL alarms as well as for coloring when using the Threshold mode.
Plot styles: You have the possibility to choose from 4 different styles.
Heatmap (uses the values and colors of HM1-HM5)
Traffic (uses the values and colors of T1-T4) -
Threshold (accesses the values RVOL Threshold)
Price (shows the normal volume bars)
HM1-5: Set different RVOL values for the Plot Style Heatmap
T1-4: Set different RVOL values for the Plot Style Traffic.
This indicator is often used with our second version Real Relative Volume - Line Indicator - Time Adjusted - DE & EN. Make sure that you use the same RVOL values in both indicators!

Colored Volume Bars standard deviation from meanThe colour bars:
Green: Price up - Volume > 2 x STD of last 21 bars
Blue: Price up - Volume > 1 x STD of last 21 bars
Maroon: Price down - Volume > 2 x STD of last 21 bars
Purple: Price down - Volume > 1 x STD of last 21 bars
Grey: not high volume bar
Green line: 2 bar sma
Red line: 8 period sma of the greenline
Bollinger band: 55 period sma of the 21 period sma with bands 1.618 deviation from the mean

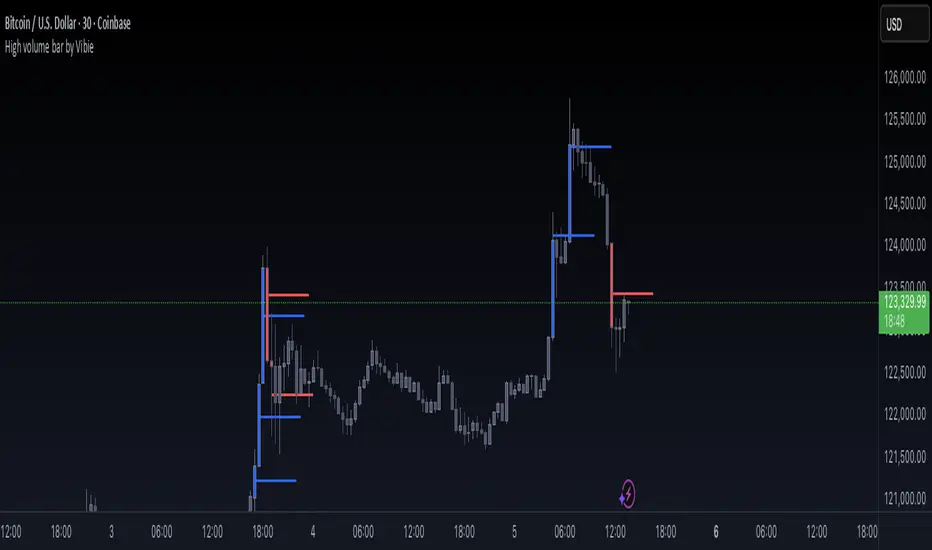
High volume bar by VibieHigh Volume Bar with Extended vPOC (Aggregation Enabled)
🧠 Concept
This indicator is designed to detect institutional activity and large traders by using statistical volume analysis and identifying key intrabar liquidity levels.
It applies Z-Score volume analysis to highlight unusually high volume candles and marks the Volume Point of Control (vPOC) inside each detected bar — the price level where the most volume was transacted.
⸻
⚙️ How It Works
1. Z-Score Volume Analysis
• The indicator calculates how far current volume deviates from its historical average using standard deviations (Z-Score).
• When the Z-Score exceeds the user-defined threshold, the candle is flagged as a High Volume Bar (HVB).
2. Multi-Exchange Aggregation
• Volumes from Binance, Bybit, and Coinbase can be aggregated into a composite volume metric.
• This provides a broader and more accurate market perspective, minimizing anomalies from individual exchanges.
3. Candle Coloring
• Bullish HVB → entire candle (body + wicks) is colored blue.
• Bearish HVB → entire candle is colored red.
• This makes large volume events immediately visible on the chart.
4. vPOC Detection
• The script examines a lower timeframe (e.g., 1 minute) within the HVB to find the price level with the highest traded volume.
• A horizontal line is drawn at that price and can be extended for multiple bars, marking a short-term liquidity zone that often acts as support or resistance.
⸻
🧭 How to Use
• vPOC levels frequently act as liquidity magnets and are often retested after the HVB appears.
• Bullish HVB + vPOC below current price = potential long entry zone.
• Bearish HVB + vPOC above price = potential short entry zone.
• Useful for identifying institutional absorption, stop runs, or hidden accumulation/distribution.
⸻
🌟 Why It’s Original and Useful
• Combines statistical volume analysis (Z-Score) with intrabar volume profiling.
• Aggregates multiple exchanges for broader accuracy.
• Offers precise liquidity levels that classic indicators don’t provide.
• Especially valuable for advanced traders looking for institutional footprints.
Slim Ribbon Volume BarsThe Slim Ribbon Volume Bars indicator is intended to be paired with the Slim Ribbon. The Slim Ribbon is also available for free in TradingView. The Slim Ribbon Volume Bars indicator changes the color of the volume bars based on the momentum condition of the Slim Ribbon. When the Ribbons have a bullish condition, the indicator colors the volume bars green. When the Ribbons have a bearish condition, the indicator colors the volume bars red. Finally, when the Ribbons have a neutral condition, the indicator colors the volume bars gray. See below for an overview of the Slim Ribbon.
The Slim Ribbon was developed by Steve Miller. Steve Miller is a 46-year veteran stock, futures and options trader. His badge on the trading floor was his initials, “SLM” and has since gone by the nickname Slim.
The Slim Ribbon is a momentum indicator . It is composed of 3 exponential moving averages (8, 13 and 21). A bullish condition occurs when the 8 period MA is above the 13 period MA and the 13 period MA is above the 21 period MA. A bearish condition occurs when the 8 period MA is below the 13 period MA and the 13 period MA is below the 21 period MA. A neutral condition occurs when the Ribbons are not in alignment.
The Slim Ribbon also notifies you when we transition from one condition to another. A green up arrow indicates that the Slim Ribbon has shifted from a neutral condition to a bullish condition. A red down arrow indicates that the Slim Ribbon has shifted from a neutral condition to a bearish condition. A blue up arrow indicates that we have shifted from a bearish condition to a neutral condition. Lastly, a blue down arrow indicates that we have shifted from a bullish condition to a neutral condition.
We would recommend using the Slim Ribbon on a candlestick chart. Steve Miller believes in the importance of visualizing trends. As a result, we have designed the Slim Ribbon to change the color of the candlesticks based on the condition of the ribbon. When the Slim Ribbon has a bullish condition, the candlesticks will turn green. When the Slim Ribbon has a bearish condition, the candlesticks will turn red. When the Slim Ribbon has a neutral condition, the candlesticks will turn gray.

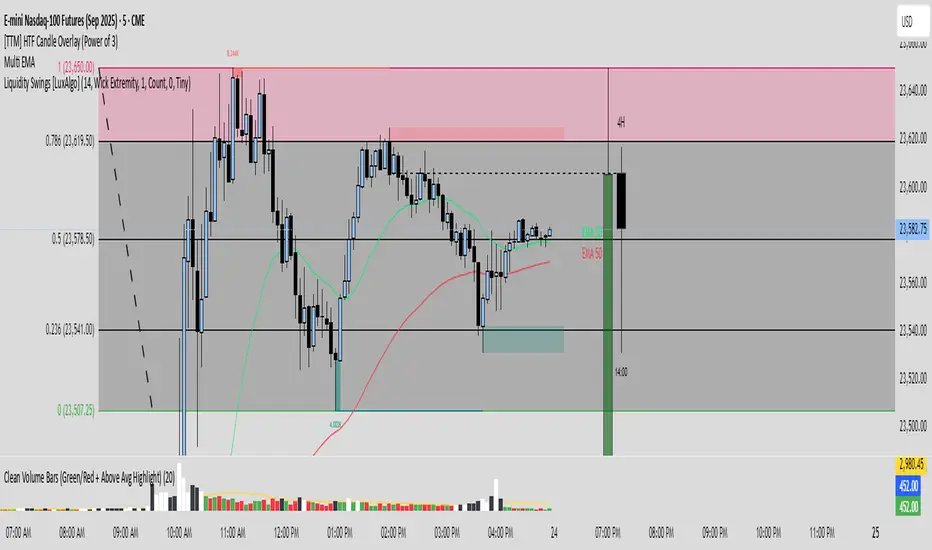
Clean Volume Bars (Green/Red + Above Avg Highlight)📊 Clean Volume Bars (Green/Red + Above Avg Highlight)
This script provides a clearer view of market volume by combining standard green/red volume bars with dynamic highlights for above-average activity.
Features:
✅ Green / Red Volume Bars – standard visualization:
Green when the candle closes higher than it opened
Red when the candle closes lower than it opened
✅ Average Volume Line – a simple moving average (default 20 periods) to track relative volume.
✅ Above Average Highlights – bars that exceed the average volume are emphasized:
White for above-average bullish volume
Black for above-average bearish volume
How to Use:
Look for white volume spikes during up candles → potential strong bullish activity.
Watch for black volume spikes during down candles → potential strong bearish pressure.
Combine with price action, trend, or other indicators for confluence (this is not a standalone trading system).
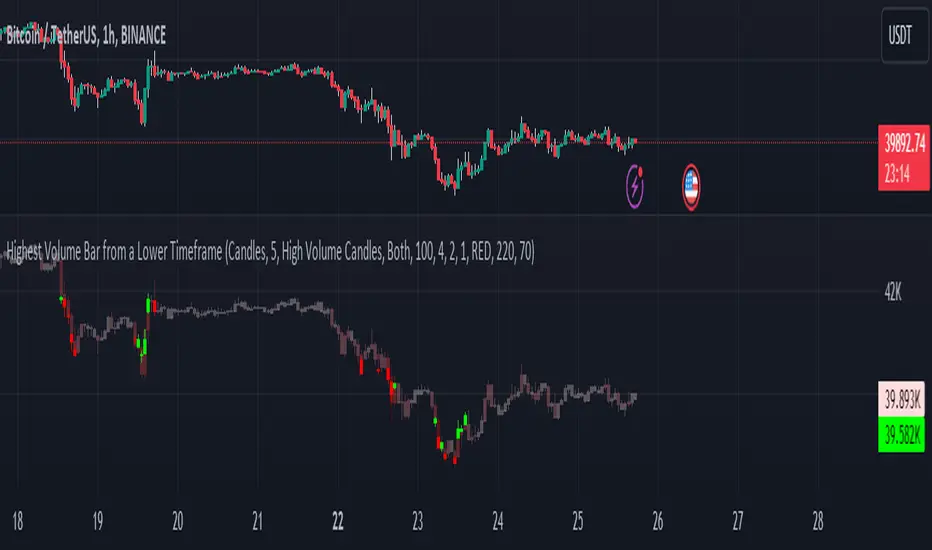
Highest Volume Bar from a Lower TimeframeVolume is an essential indicator in technical analysis as it can signal confirmations of movement, reversals, and more. This indicator was developed to identify candles with high volume in both the current timeframe and a lower timeframe
SETTINGS
The indicator has two display modes: Candles and Volume.
- Candles: it presents a traditional candlestick chart that shows the candles of the current timeframe, along with the candle with the highest volume from the lower timeframe.
- Volume: it features a volume chart displaying the volume of the current timeframe in histogram form, as well as the bar with the highest volume from the lower timeframe represented in columns.
LOWER TIME FRAME SETTINGS
- Lower Time Frame: the lower timeframe to be taken into consideration.
- LTF Candle Display: determines which candles from the current timeframe chart will display the candles with the highest volume from the lower timeframe.
- Volume Display: determines how the volume bars will be presented for both the current timeframe and the lower timeframe.
VOLUME LEVEL SETTINGS
- SMA Period: the time period for calculating the volume average.
- High Volume: the multiplier used to classify a candle as having high volume.
- Medium Volume: the multiplier used to classify a candle as having medium volume.
- Low Volume: the multiplier used to classify a candle as having low volume.
- Show Volume MA: enable this option to display the Volume MA on the chart.
COLOR SETTINGS
- Candle Color: the color to be used in the charts.
- Shade Intensity : the intensity of the shades for volume levels.
- Transparency : the transparency to be used for the candles of the current timeframe when displaying candles with higher volume from the lower timeframe.
Power Indicator - EMAs + VWAP + Volume BarThe Power Indicator is intended to return some exponential moving average, vwap, volume bar, and others. With this compilation, you will be able to use them as one indicator in Trading View.
The components are:
- EMA9 - Exponential Moving Average of 9 days
- EMA21 - Exponential Moving Average of 21 days
- EMA50 - Exponential Moving Average of 50 days
- EMA200 - Exponential Moving Average of 200 days
- Volume Bar - This indicator provides the volume of the candle and its strength by showing different colors. It's a way to check expressive volume in one bar.
- Vwap line
- Indicator
If you have any questions, let me know!